
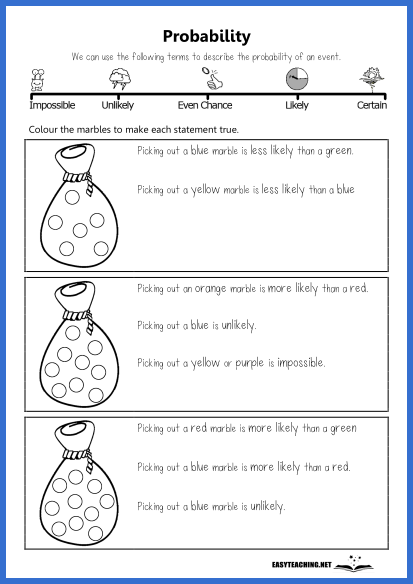
Marbles & Probability (1)
Read the probability statements and colour the marbles to match (middle years).

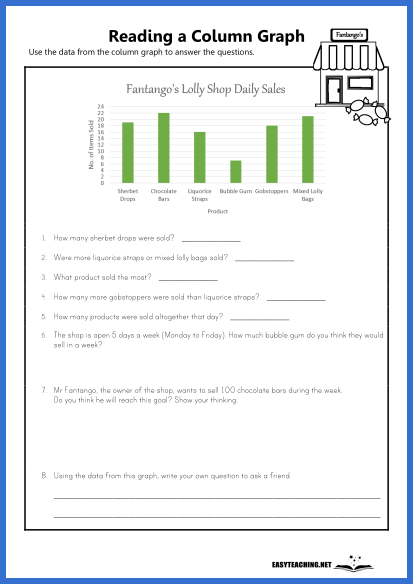
Reading a Column Graph: Lolly Shop
Use the data from the column graph to answer the questions.

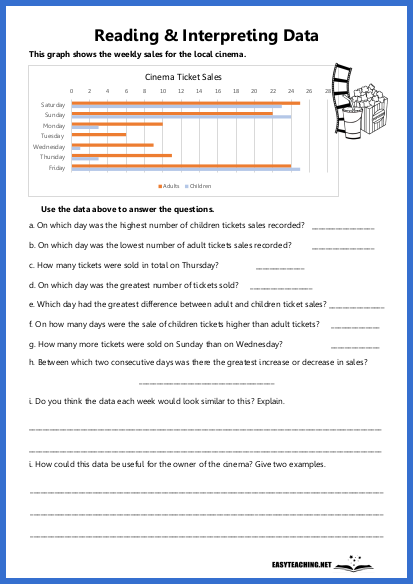
Interpret Data: Movies (3)
Read and interpret the data from the bar graph to answer the questions (upper years).

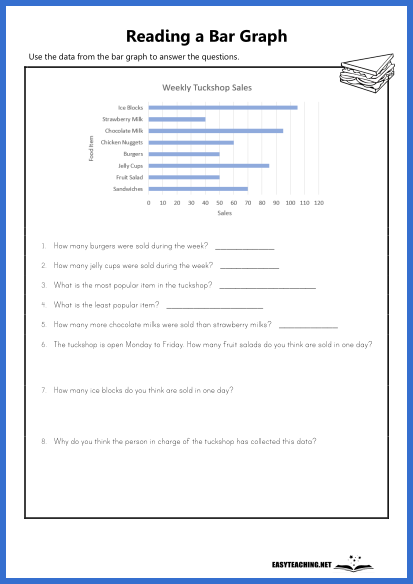
Reading a Bar Graph: Tuck Shop
Use the data from the bar graph to answer the questions.
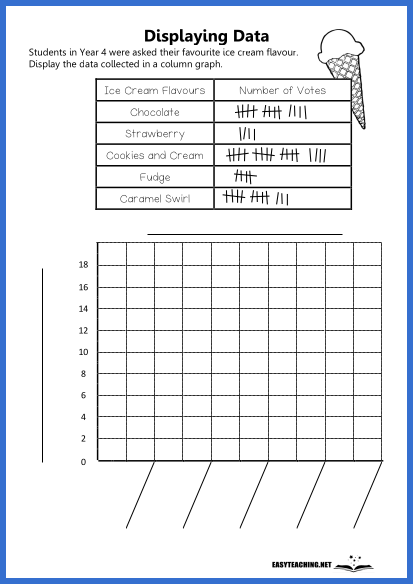
Reading & Graphing Data: Ice Cream
Record the data from the table on the graph.

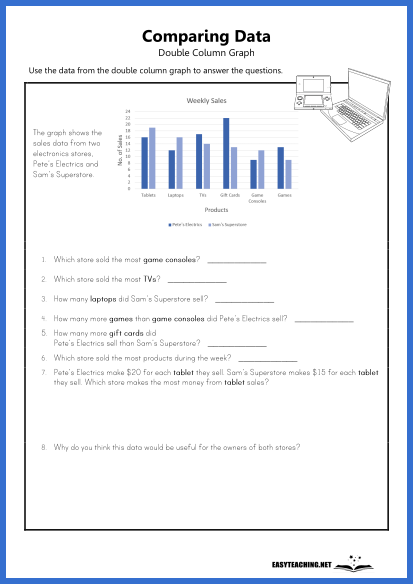
Comparing Data on a Double Column Graph: Electronics
Use the data from the double column graph to answer the questions.

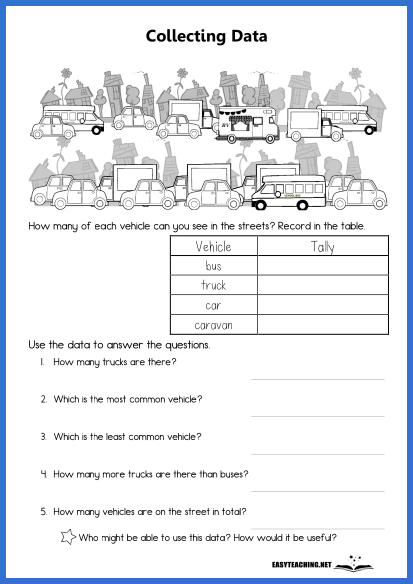
Collecting Data: In the Street
Use the picture to record data in a table and then answer questions about the data.

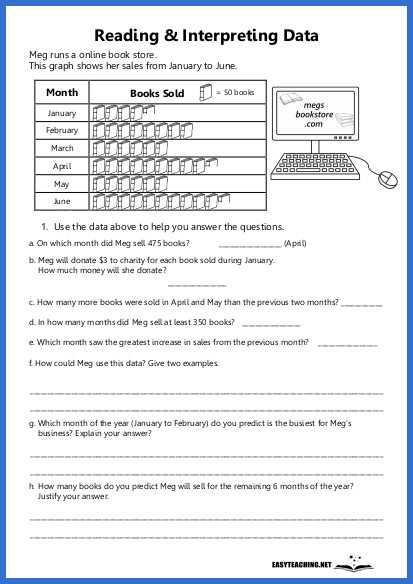
Interpret Data: Books (2)
Read and interpret the data from the pictograph to answer the questions (middle and upper years).

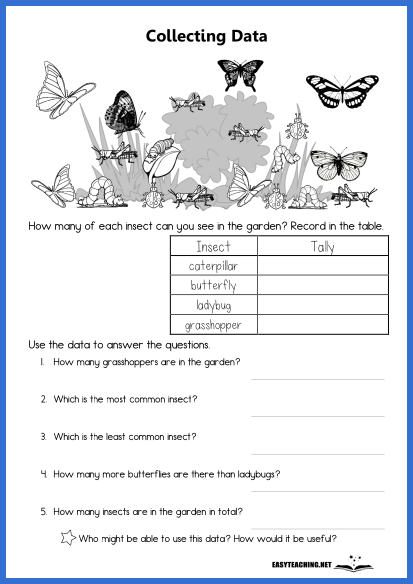
Collecting Data: In the Garden
Use the picture to record data in a table and then answer questions about the data.

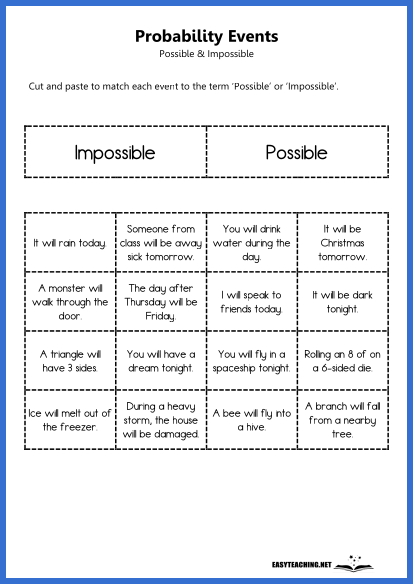
Probability Event Match: Possible & Impossible
Cut and paste events to match the terms ‘Possible’ and ‘Impossible’.

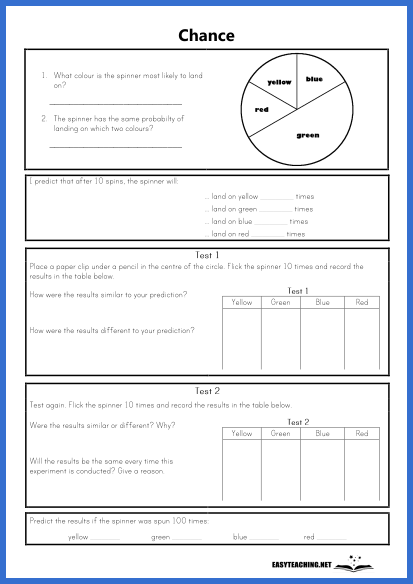
Chance Spinner Experiment (2)
Conduct a chance experiment using a spinner and answer questions about likelihood.

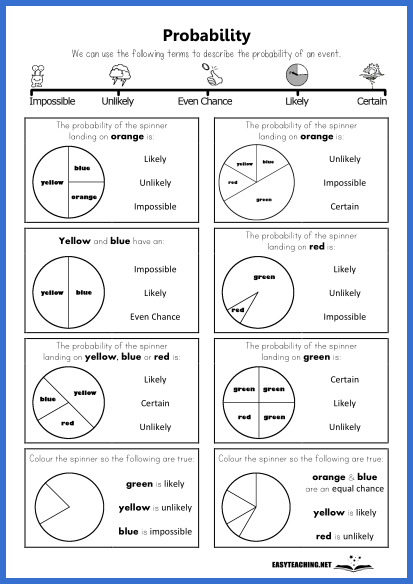
Spinner Probabilities
Describe the probability of events on each spinner.


