
TOPICS
Chance & Data
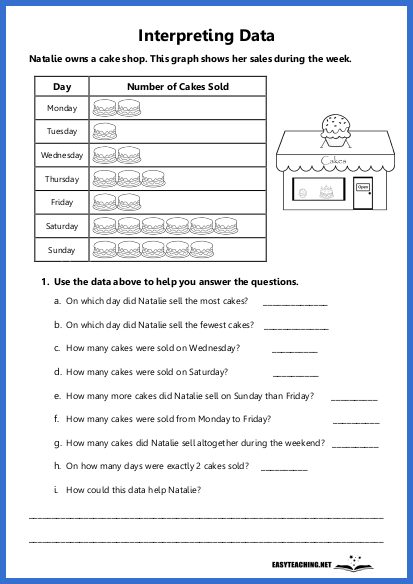
Reading a Pie Chart: Transport
Overview:
A data interpretation activity where students analyse a pie chart to answer questions about transport methods used by students to get to school. Designed for students in year 4.
Learning Objectives:
- Interpret data presented in a pie chart.
- Extract and compare information to answer questions accurately.
- Develop problem-solving skills through real-world data analysis.
How the Activity Works:
Students are given a pie chart representing different transport methods (train, walking, bike, car, bus). Each section of the chart is labelled with either a fraction, percentage, or number of students. Students answer a series of questions based on the chart, such as identifying the most common transport method, calculating how many students walk, or comparing the number of students who take a car to those who ride a bike. This activity offers a practical and engaging way for students to practise reading and interpreting pie charts.
Related resources


EASYTEACHING.NET


