
TOPICS

Maths
Browse our collection of resources that support the teaching of chance and data concepts. These resources give students the opportunity to describe and calculate the probability of events, conduct chance experiments, collect and display data and more.
Use the side menu to search for specific subtopics or use the filter above to narrow the results by resource type and/or grade level.


Calculate Probability as a Fraction

Calculate the probability of each event as a fraction.

Interpret Data: Books (Yrs 2,3)
Read and interpret the data from the pictograph to answer the questions (early and middle years)

Collect & Present Data: Toys
Use the picture to record data in a table and then present the data in a bar graph.

Collect & Present Data: Pets
Use the picture to record data in a table and then present the data in a bar graph.

Present Data: Lunch
Record the given results on an empty bar graph and then answer the questions.

Present Data: Fruit
Record the given results on an empty bar graph and then answer the questions.

Present Data: Weather (Early)
Record the given results on an empty bar graph and then answer the questions (early years).

Present Data: Weather (Middle)
Record the given results on an empty bar graph and then answer the questions (middle years).

Present Data: Seeds
Record the given results on an empty line graph and then answer the questions.

Interpret Data: Weather
Read and interpret the data from the bar graph to answer the questions.

Interpret Data: School
Read and interpret the data from the bar graph to answer the questions.

Interpret Data: Seeds
Read and interpret the data from the line graph to answer the questions.

Interpret Data: Pizzas
Read and interpret the data from the pictograph to answer the questions.
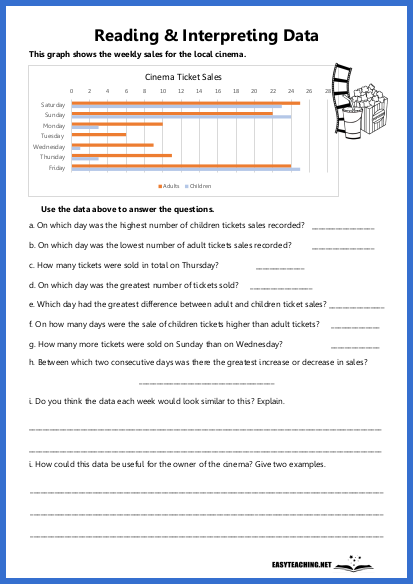
Interpret Data: Movies (Upper)
Read and interpret the data from the bar graph to answer the questions (upper years).
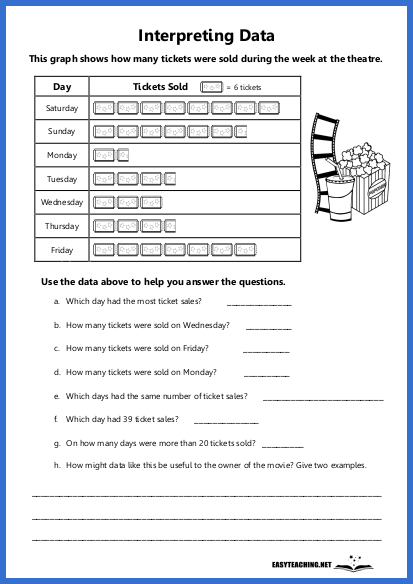
Interpret Data: Movies (Middle)
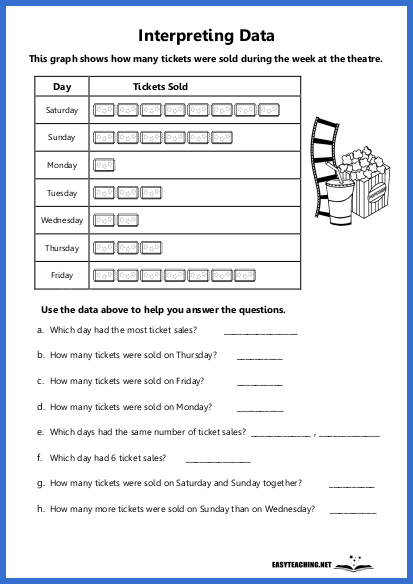
Read and interpret the data from the pictograph to answer the questions (middle years).
Interpret Data: Movies (Early)
Read and interpret the data from the pictograph to answer the questions (early years).
EASYTEACHING.NET


