
TOPICS
Maths
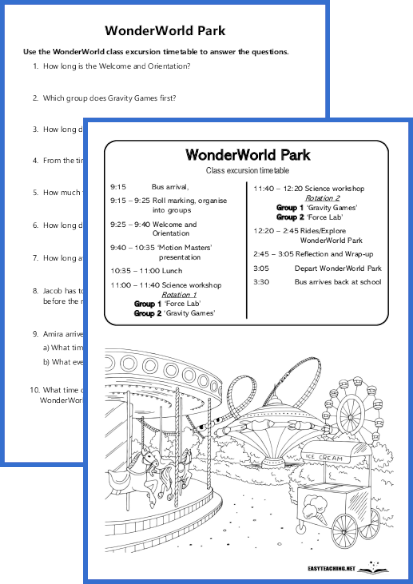
Present Data: Fruit
 Available only to premium members
EASYTEACHING.NET
Overview:
Students use a tally chart to complete an empty bar graph and answer questions about favourite fruits. Designed for early to middle years students.
Learning Objectives:
- Interpret and transfer data from a tally chart to a bar graph.
- Analyse data to answer questions and draw conclusions.
- Develop data-handling and critical-thinking skills.
How the Activity Works:
Students are given a tally chart showing the number of children who prefer different types of fruit. They use this data to complete an empty bar graph, ensuring accurate representation. After graphing the data, students answer questions such as identifying the most popular fruit and considering how the information could help with planning a class party. This activity encourages students to interpret real-world data and think critically about its applications.
 Become a member
Related resources


EASYTEACHING.NET


