
TOPICS
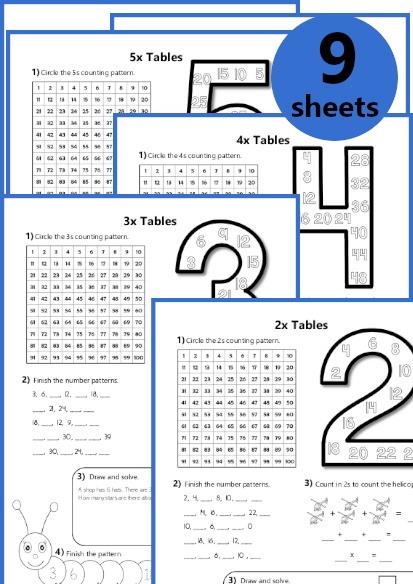
Maths
Reading a Double Line Chart: Rainfall
Overview:
A data interpretation activity where students analyse a double line chart showing annual rainfall data for two cities, Brisbane and Darwin, to answer comparison and analysis questions. Designed for year 5 and 6 students.
Learning Objectives:
- Interpret and compare data from a double line chart.
- Identify similarities and differences between two data sets.
- Develop critical thinking skills by considering how data might be used in real-world contexts.
How the Activity Works:
Students are presented with a double line chart showing monthly rainfall in Brisbane and Darwin over the course of a year. They answer questions such as identifying the wettest month for each city, determining the month when rainfall was most similar, and calculating the rainfall difference between the two cities over the first three months. Students also analyse how the two data sets are similar and different and suggest who might use this data (e.g., farmers, meteorologists) and how it could be used (e.g., for weather predictions or crop planning). This activity provides a practical and engaging way for students to practise interpreting complex data and understanding its applications.
Related resources


EASYTEACHING.NET


