TOPICS
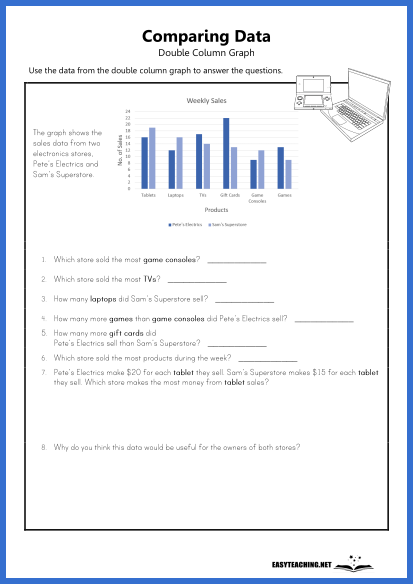
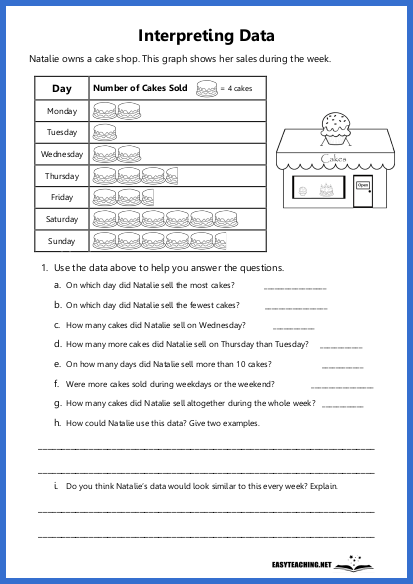
Chance & Data
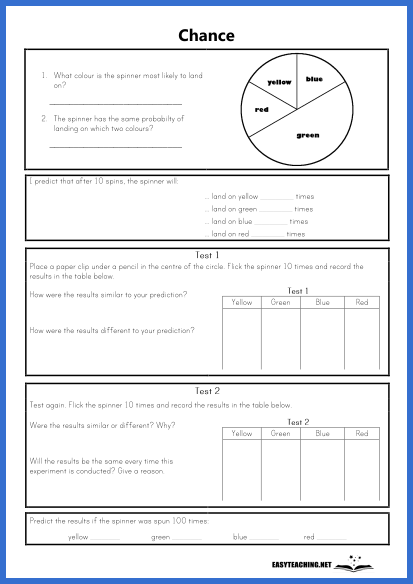
Spinner Probabilities
EASYTEACHING.NET
Overview:
A probability activity where students describe the likelihood of various outcomes based on different spinner designs. Designed for students in year 3 and year 4.
Learning Objectives:
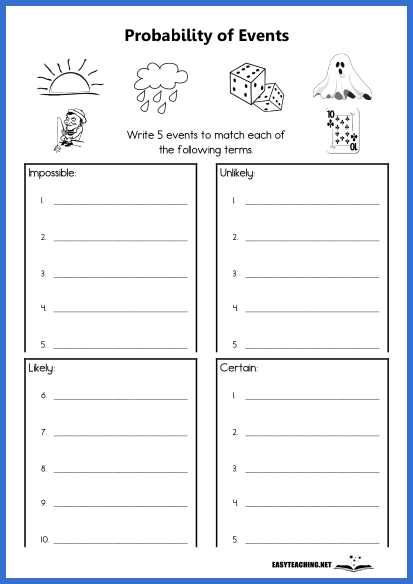
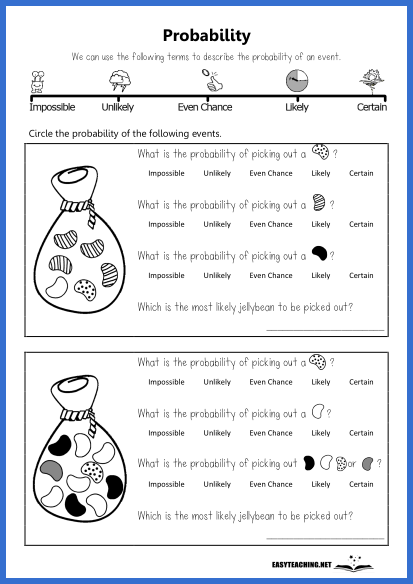
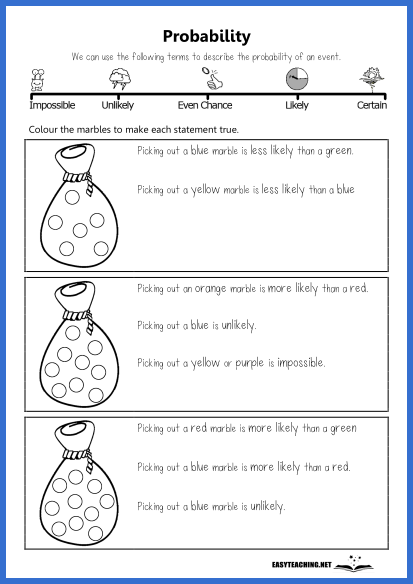
- Identify and describe the probability of events using terms such as likely, unlikely, certain, and impossible.
- Analyse spinner sections to determine the likelihood of landing on specific colours or sections.
- Develop a deeper understanding of chance and probability through visual models.
How the Activity Works:
Students are presented with spinners of varying designs, each divided into different coloured sections. They analyse each spinner to describe the probability of landing on specific colours. For example, students may identify that landing on orange is "likely" if orange covers half the spinner or "impossible" if orange is not present at all. This activity provides a practical and engaging way for students to practise describing and understanding probability using visual models.
Related resources

