
Interpret Data: Books (Yrs 2,3)
Read and interpret the data from the pictograph to answer the questions (early and middle years)

Collect & Present Data: Toys
Use the picture to record data in a table and then present the data in a bar graph.


Collect & Present Data: Pets
Use the picture to record data in a table and then present the data in a bar graph.


Present Data: Weather (Early)
Record the given results on an empty bar graph and then answer the questions (early years).


Present Data: Weather (Middle)
Record the given results on an empty bar graph and then answer the questions (middle years).
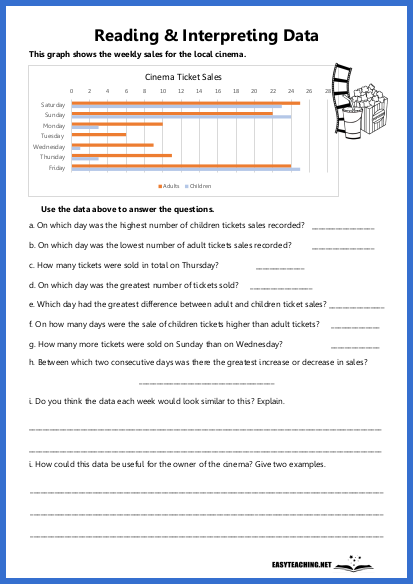
Interpret Data: Movies (Upper)
Read and interpret the data from the bar graph to answer the questions (upper years).
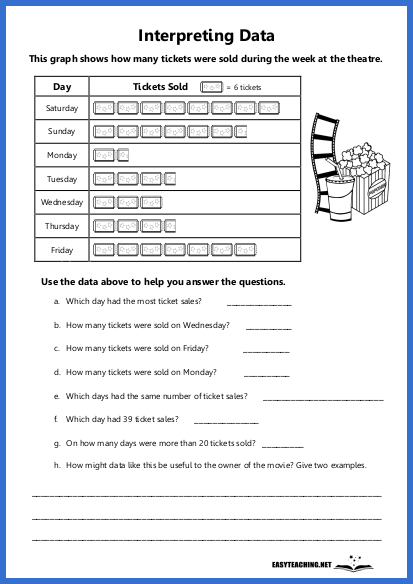
Interpret Data: Movies (Middle)
Read and interpret the data from the pictograph to answer the questions (middle years).
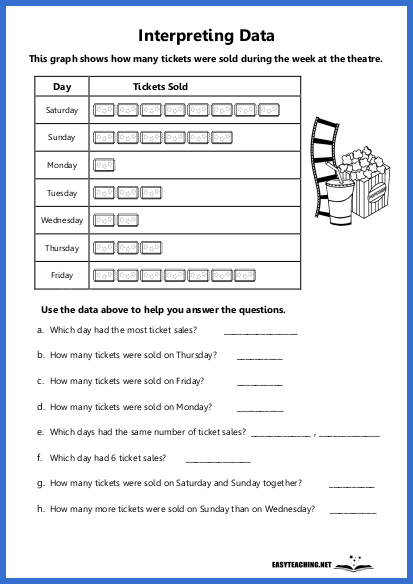
Interpret Data: Movies (Early)
Read and interpret the data from the pictograph to answer the questions (early years).

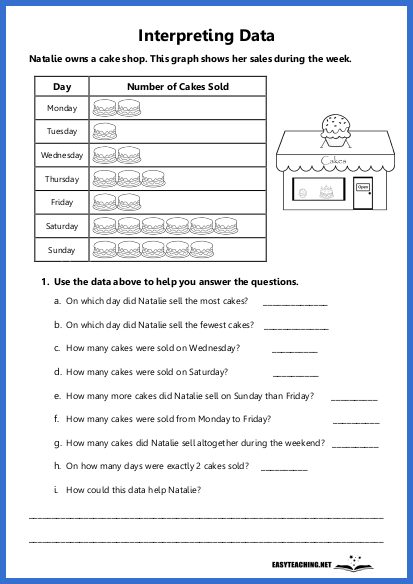
Interpret Data: Cakes (Yrs 2,3)
Read and interpret the data from the pictograph to answer the questions (early and middle years).


