
TOPICS

Maths
Browse our collection of resources that support the teaching of chance and data concepts. These resources give students the opportunity to describe and calculate the probability of events, conduct chance experiments, collect and display data and more.
Use the side menu to search for specific subtopics or use the filter above to narrow the results by resource type and/or grade level.

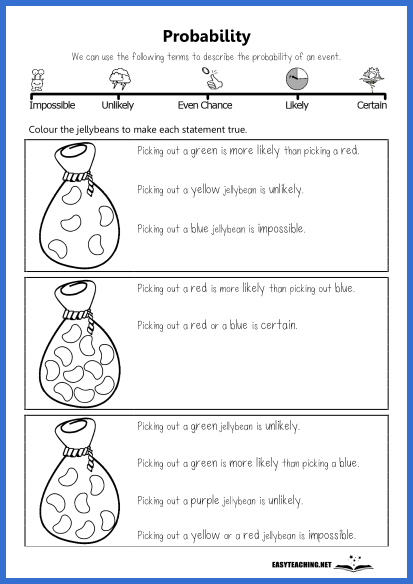
Jellybeans & Probability (Yr 3,4)

Read the probability statements and colour the jellybeans to match.
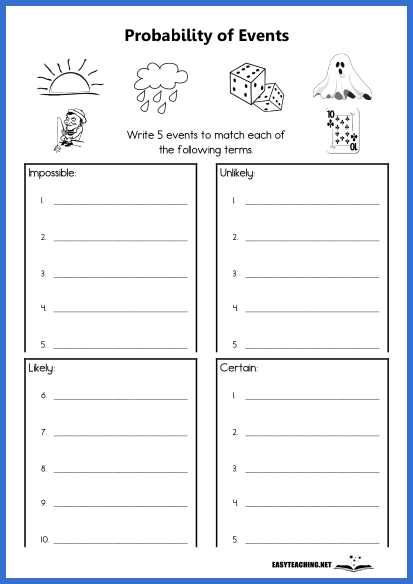
List Events: Certain, Likely, Unlikely, Impossible
Write events to match the terms ‘Certain’, ‘Impossible’, ‘Likely’ and ‘Unlikely’.

List Events: Possible & Impossible
Write events to match the terms ‘Possible’ and ‘Impossible’.
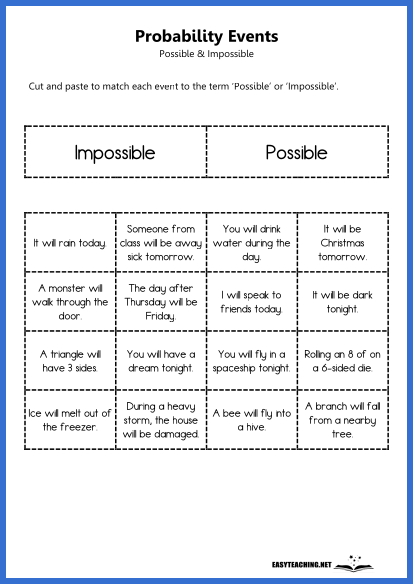
Probability Event Match: Possible & Impossible
Cut and paste events to match the terms ‘Possible’ and ‘Impossible’.
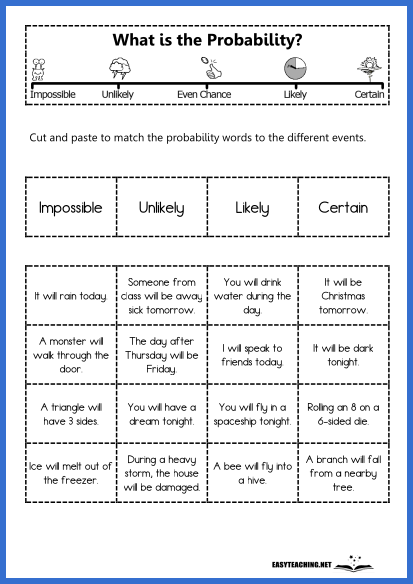
Probability Event Match: Certain, Likely, Unlikely, Impossible
Cut and paste events to match the terms ‘Certain’, ‘Impossible’, ‘Likely’ and ‘Unlikely’.
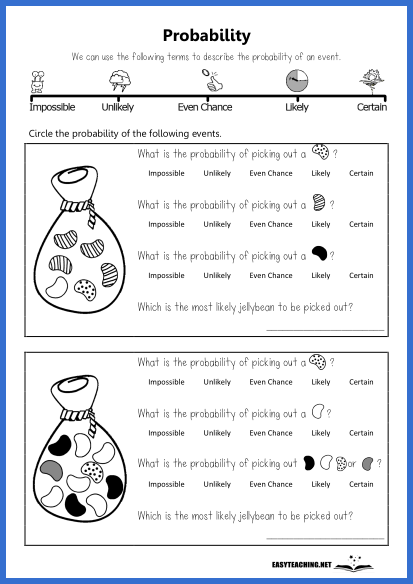
Using Probability Terms
Describe the probability of each event using probability words.
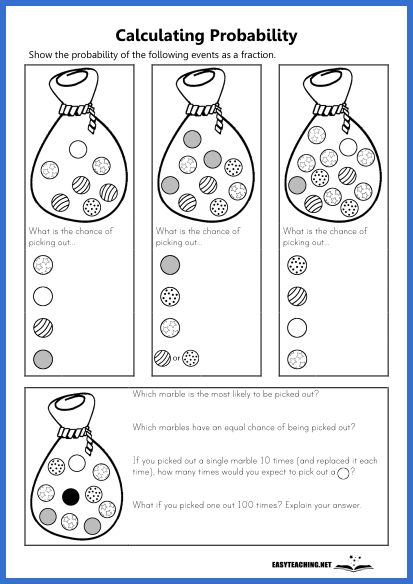
Show Probability as a Fraction (2)
Calculate the probability of each event and express as fractions.
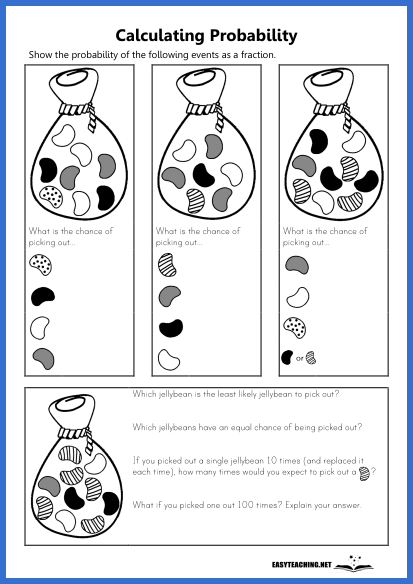
Show Probability as a Fraction (1)
Calculate the probability of each event and express as fractions.
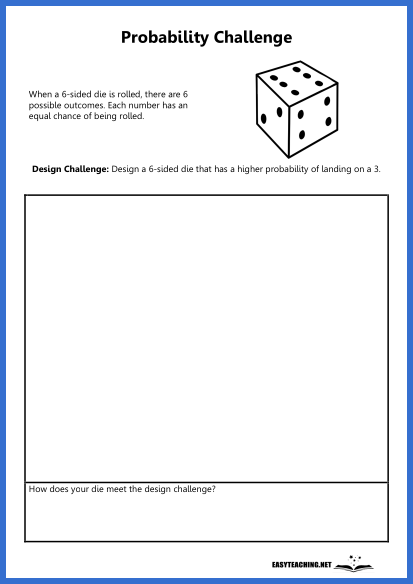
Probability Challenge
A design challenge to test knowledge of probability.
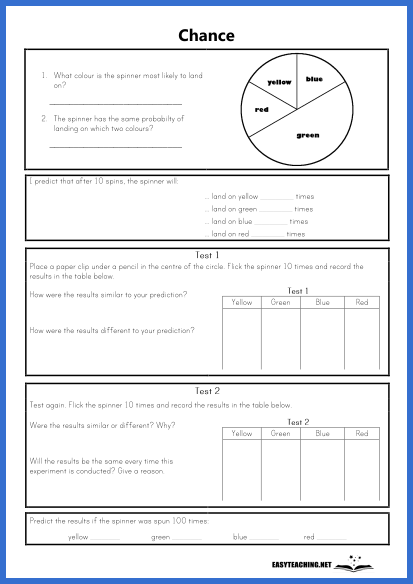
Chance Spinner Experiment (2)
Conduct a chance experiment using a spinner and answer questions about likelihood.
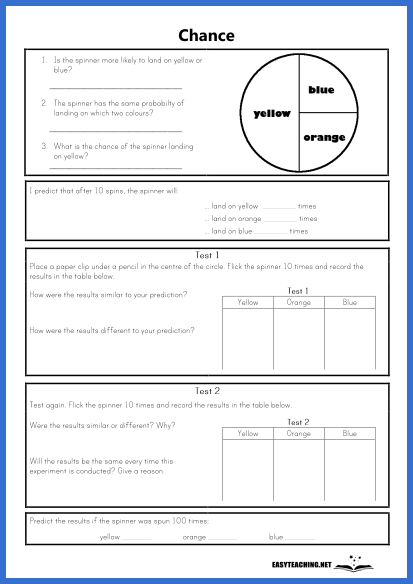
Chance Spinner Experiment (1)
Conduct a chance experiment using a spinner and answer questions about likelihood.
Related Material
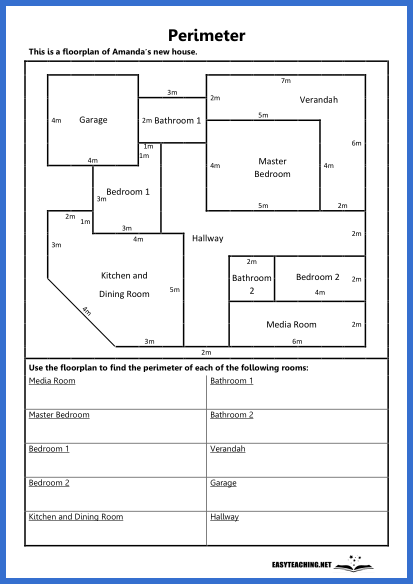
Calculate Perimeter from House Plan

Reading a Bus Timetable
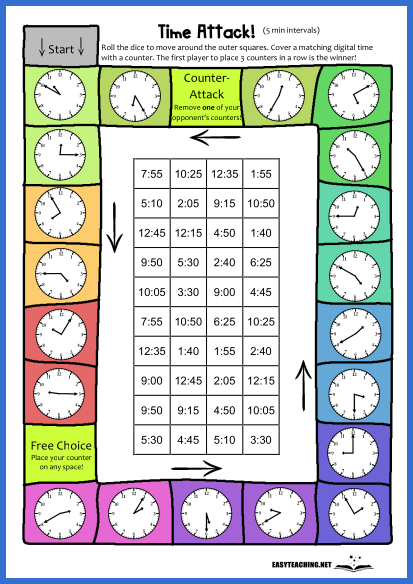
Time Attack Game, 5 Minute Intervals

Reading a Swimming Carnival Timetable

Waterville Bus Timetable

Fraction Run Game

Reading a School Timetable
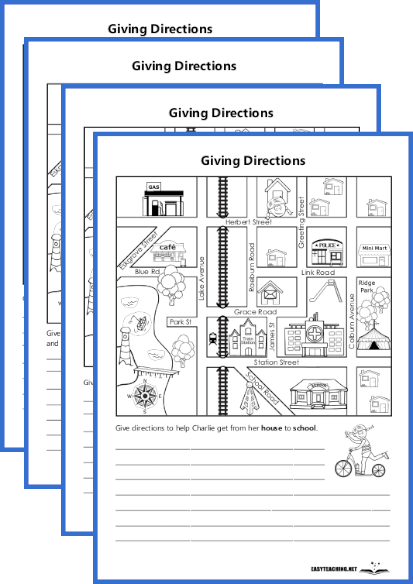
Giving Directions in Lake City
EASYTEACHING.NET


