
TOPICS

Maths
Browse our collection of data worksheets aimed at helping students collect, read and interpret data. These resources give students opportunities to work with bar graphs, pie charts, pictographs, column graphs and more.
Use the filter above to narrow the results by resource type and/or grade level.

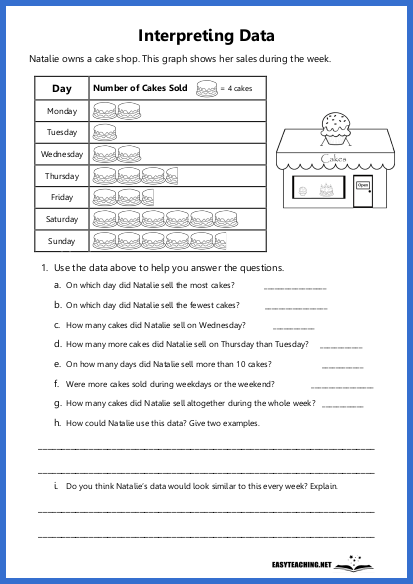
Interpret Data: Cakes (Yrs 4,5)

Read and interpret the data from the pictograph to answer the questions (middle and upper years).
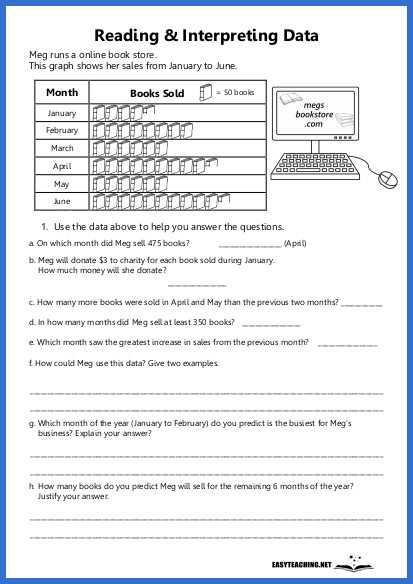
Interpret Data: Books (Yrs 4,5)
Read and interpret the data from the pictograph to answer the questions (middle and upper years).

Reading a Pie Chart: Transport
Use the data from the pie chart to answer the questions.

Reading a Pictograph: Rewards Day
Use the data from the pictograph to answer the questions.
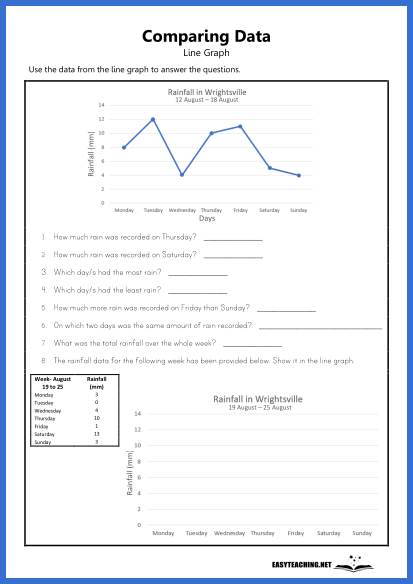
Reading a Line Chart: Rainfall
Use the data from the line chart to answer the questions.
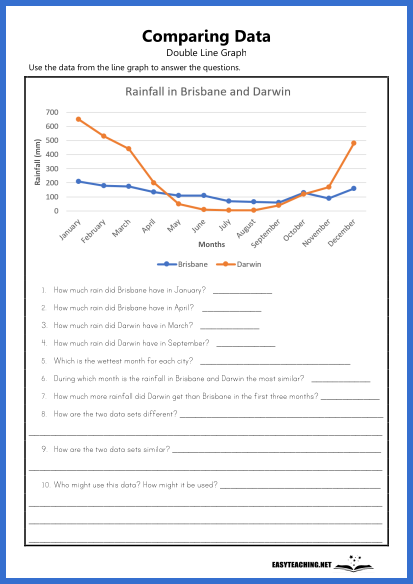
Reading a Double Line Chart: Rainfall
Use the data from the double line chart to answer the questions.
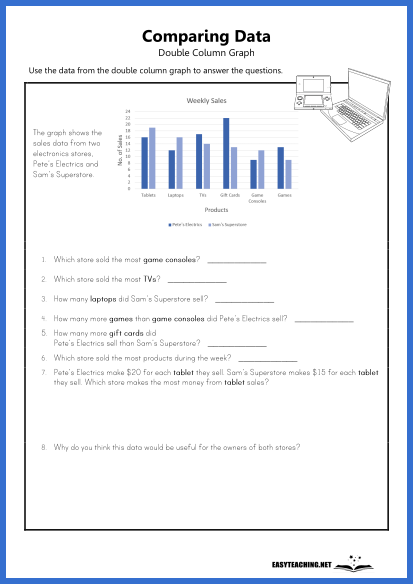
Comparing Data on a Double Column Graph: Electronics
Use the data from the double column graph to answer the questions.
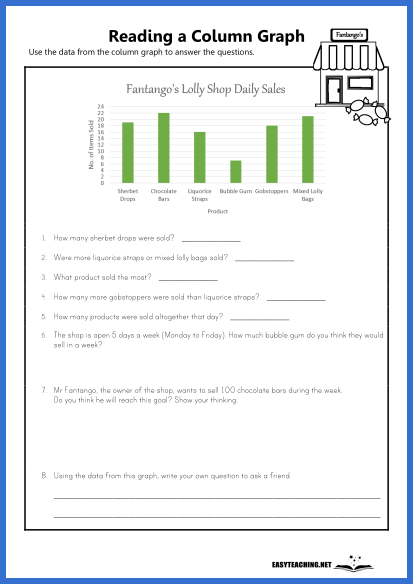
Reading a Column Graph: Lolly Shop
Use the data from the column graph to answer the questions.
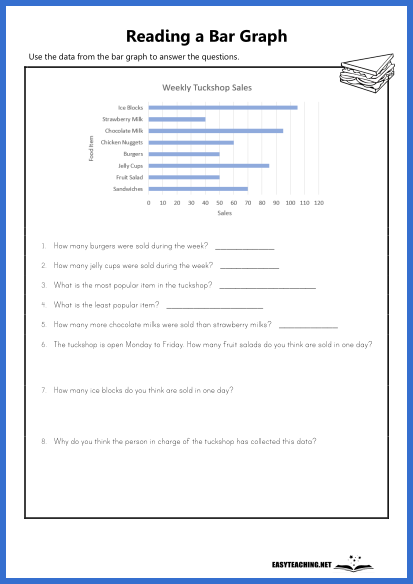
Reading a Bar Graph: Tuck Shop
Use the data from the bar graph to answer the questions.
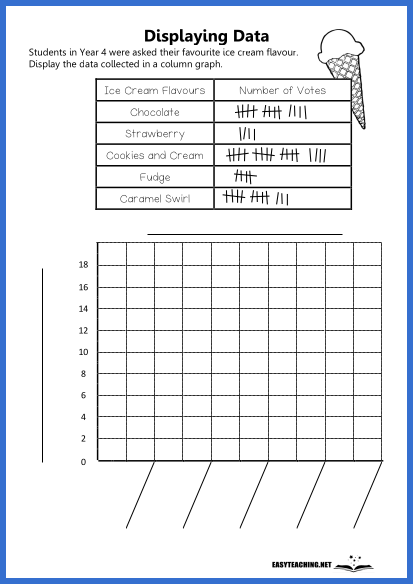
Reading & Graphing Data: Ice Cream
Record the data from the table on the graph.
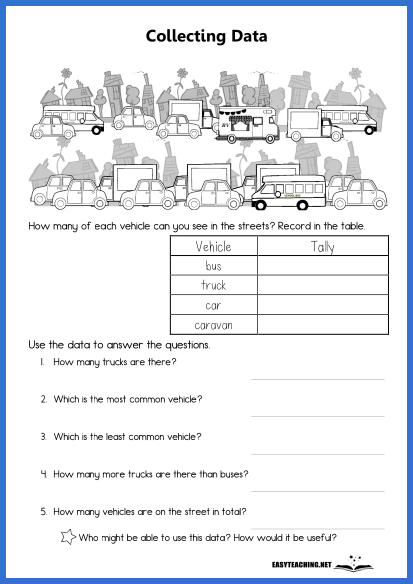
Collecting Data: In the Street
Use the picture to record data in a table and then answer questions about the data.
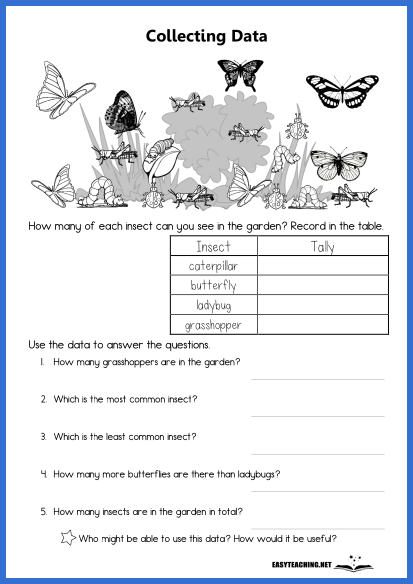
Collecting Data: In the Garden
Use the picture to record data in a table and then answer questions about the data.
Related Material

Interpret Data: School

Interpret Data: Books (Yrs 2,3)

Calculate Probability as a Fraction

Collect & Present Data: Pets

Present Data: Fruit

Interpret Data: Seeds

Interpret Data: Pizzas

Present Data: Weather (Early)
EASYTEACHING.NET


